Tuesday, 14 June 2022

Getting Started with OWASP ZAP


Getting Started

Overview 

This guide is intended to serve as a basic introduction for using ZAP to perform security testing, even if you don’t have a background in security testing. To that end, some security testing concepts and terminology is included but this document is not intended to be a comprehensive guide to either ZAP or security testing.

It is also available as a pdf to make it easier to print.

Security Testing Basics 

Software security testing is the process of assessing and testing a system to discover security risks and vulnerabilities of the system and its data. There is no universal terminology but for our purposes, we define assessments as the analysis and discovery of vulnerabilities without attempting to actually exploit those vulnerabilities. We define testing as the discovery and attempted exploitation of vulnerabilities.

Security testing is often broken out, somewhat arbitrarily, according to either the type of vulnerability being tested or the type of testing being done. A common breakout is:

  • Vulnerability Assessment – The system is scanned and analyzed for security issues.
  • Penetration Testing – The system undergoes analysis and attack from simulated malicious attackers.
  • Runtime Testing – The system undergoes analysis and security testing from an end-user.
  • Code Review – The system code undergoes a detailed review and analysis looking specifically for security vulnerabilities.

Note that risk assessment, which is commonly listed as part of security testing, is not included in this list. That is because a risk assessment is not actually a test but rather the analysis of the perceived severity of different risks (software security, personnel security, hardware security, etc.) and any mitigation steps for those risks.

More About Penetration Testing 

Penetration Testing (pentesting) is carried out as if the tester was a malicious external attacker with a goal of breaking into the system and either stealing data or carrying out some sort of denial-of-service attack.

Pentesting has the advantage of being more accurate because it has fewer false positives (results that report a vulnerability that isn’t actually present), but can be time-consuming to run.

Pentesting is also used to test defence mechanisms, verify response plans, and confirm security policy adherence.

Automated pentesting is an important part of continuous integration validation. It helps to uncover new vulnerabilities as well as regressions for previous vulnerabilities in an environment which quickly changes, and for which the development may be highly collaborative and distributed.

The Pentesting Process 

Both manual and automated pentesting are used, often in conjunction, to test everything from servers, to networks, to devices, to endpoints. This document focuses on web application or web site pentesting.

Pentesting usually follows these stages:

  • Explore – The tester attempts to learn about the system being tested. This includes trying to determine what software is in use, what endpoints exist, what patches are installed, etc. It also includes searching the site for hidden content, known vulnerabilities, and other indications of weakness.
  • Attack – The tester attempts to exploit the known or suspected vulnerabilities to prove they exist.
  • Report – The tester reports back the results of their testing, including the vulnerabilities, how they exploited them and how difficult the exploits were, and the severity of the exploitation.
Pentesting Goals

The ultimate goal of pentesting is to search for vulnerabilities so that these vulnerabilities can be addressed. It can also verify that a system is not vulnerable to a known class or specific defect; or, in the case of vulnerabilities that have been reported as fixed, verify that the system is no longer vulnerable to that defect.

Introducing ZAP 

Zed Attack Proxy (ZAP) is a free, open-source penetration testing tool being maintained under the umbrella of the Open Web Application Security Project (OWASP). ZAP is designed specifically for testing web applications and is both flexible and extensible.

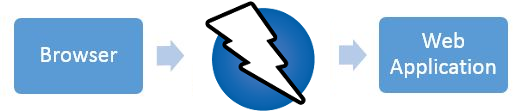
At its core, ZAP is what is known as a “man-in-the-middle proxy.” It stands between the tester’s browser and the web application so that it can intercept and inspect messages sent between browser and web application, modify the contents if needed, and then forward those packets on to the destination. It can be used as a stand-alone application, and as a daemon process.

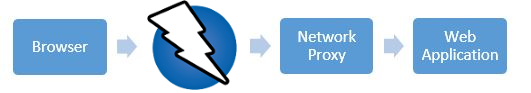
If there is another network proxy already in use, as in many corporate environments, ZAP can be configured to connect to that proxy.

ZAP provides functionality for a range of skill levels – from developers, to testers new to security testing, to security testing specialists. ZAP has versions for each major OS and Docker, so you are not tied to a single OS. Additional functionality is freely available from a variety of add-ons in the ZAP Marketplace, accessible from within the ZAP client.

Because ZAP is open-source, the source code can be examined to see exactly how the functionality is implemented. Anyone can volunteer to work on ZAP, fix bugs, add features, create pull requests to pull fixes into the project, and author add-ons to support specialized situations.

As with most open source projects, donations are welcome to help with costs for the projects. You can find a donate button on the owasp.org page for ZAP at https://owasp.org/www-project-zap/.

Install and Configure ZAP 

ZAP has installers for Windows, Linux, and Mac OS/X. There are also Docker images available on the download site listed below.

Install ZAP

The first thing to do is install ZAP on the system you intend to perform pentesting on. Download the appropriate installer from the Download page.

Note that ZAP requires Java 8+ in order to run. The Mac OS/X installer includes an appropriate version of Java but you must install Java 8+ separately for Windows, Linux, and Cross-Platform versions. The Docker versions do not require you to install Java.

Once the installation is complete, launch ZAP and read the license terms. Click Agree if you accept the terms, and ZAP will finish installing, then ZAP will automatically start.

Persisting a Session

When you first start ZAP, you will be asked if you want to persist the ZAP session. By default, ZAP sessions are always recorded to disk in a HSQLDB database with a default name and location. If you do not persist the session, those files are deleted when you exit ZAP.

If you choose to persist a session, the session information will be saved in the local database so you can access it later, and you will be able to provide custom names and locations for saving the files.

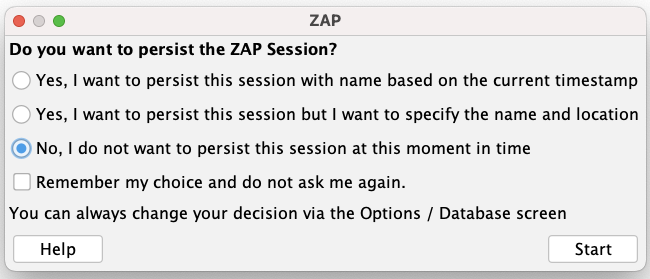
For now, select No, I do not want to persist this session at this moment in time, then click Start. The ZAP sessions will not be persisted for now.
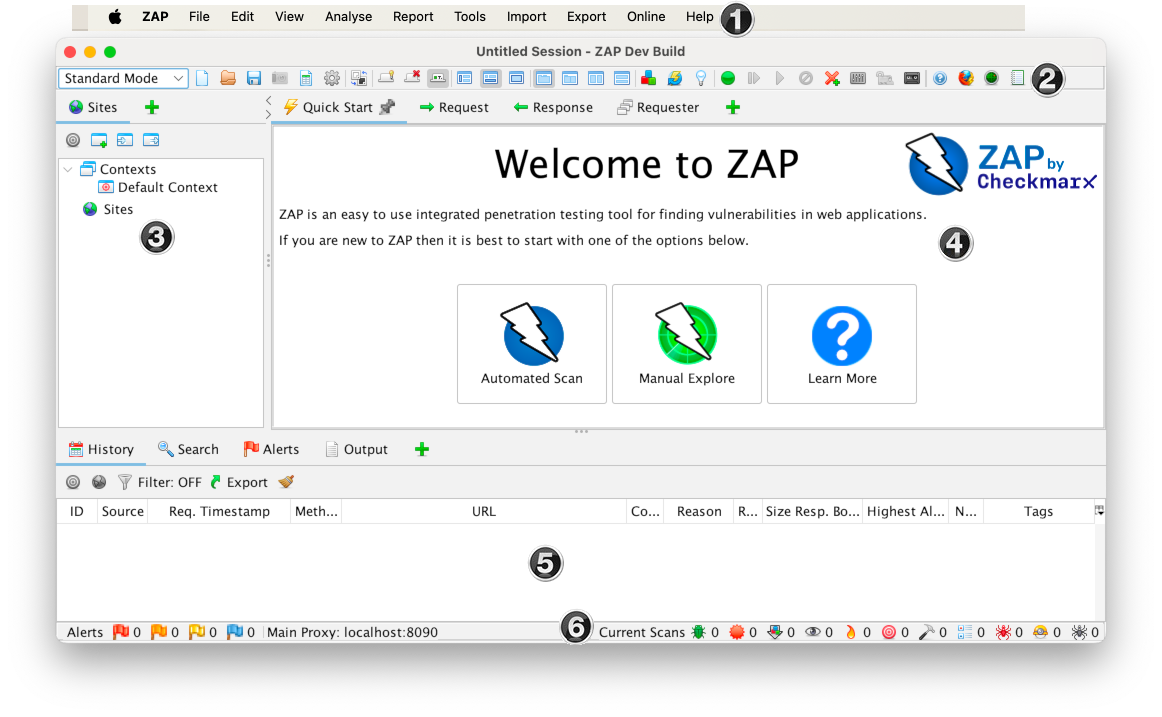
ZAP Desktop UI 

The ZAP Desktop UI is composed of the following elements:

  1. Menu Bar – Provides access to many of the automated and manual tools.
  2. Toolbar – Includes buttons which provide easy access to most commonly used features.
  3. Tree Window – Displays the Sites tree and the Scripts tree.
  4. Workspace Window – Displays requests, responses, and scripts and allows you to edit them.
  5. Information Window – Displays details of the automated and manual tools.
  6. Footer – Displays a summary of the alerts found and the status of the main automated tools.

While using ZAP, you can click Help on the Menu Bar or press F1 to access context-sensitive help from the ZAP Desktop User Guide. It is also available online.

For more information about the UI, see ZAP UI Overview in the ZAP online documentation.

ZAP also supports a powerful API and command line functionality, both of which are beyond the scope of this guide.

IMPORTANT: You should only use ZAP to attack an application you have permission to test with an active attack. Because this is a simulation that acts like a real attack, actual damage can be done to a site’s functionality, data, etc. If you are worried about using ZAP, you can prevent it from causing harm (though ZAP’s functionality will be significantly reduced) by switching to safe mode.

To switch ZAP to safe mode, click the arrow on the mode dropdown on the main toolbar to expand the dropdown list and select Safe Mode.

Running an Automated Scan

The easiest way to start using ZAP is via the Quick Start tab. Quick Start is a ZAP add-on that is included automatically when you installed ZAP.

To run a Quick Start Automated Scan :

  1. Start ZAP and click the Quick Start tab of the Workspace Window.
  2. Click the large Automated Scan button.
  3. In the URL to attack text box, enter the full URL of the web application you want to attack.
  4. Click the Attack

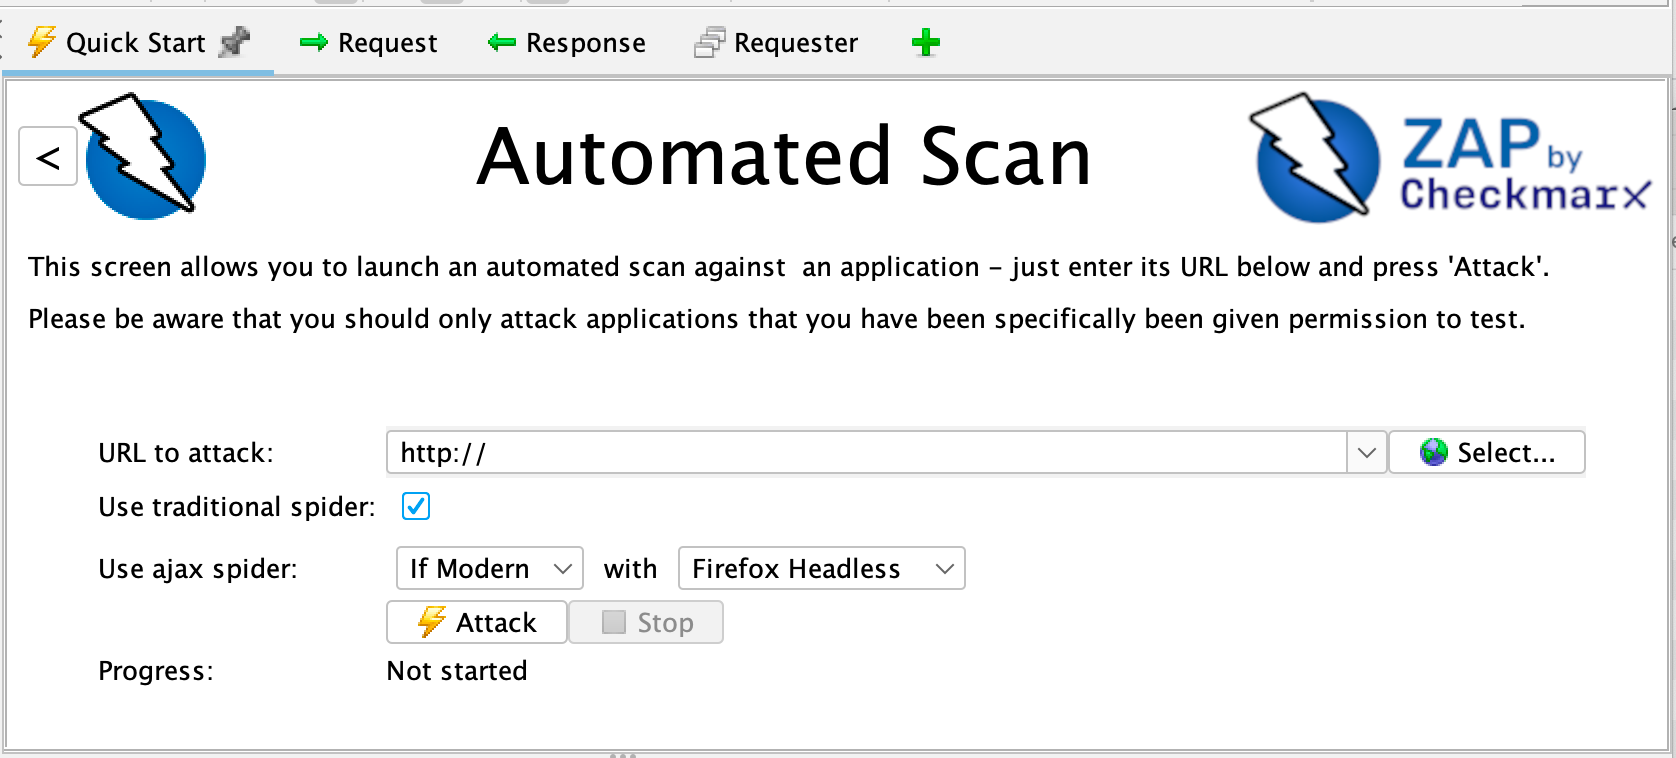
ZAP will proceed to crawl the web application with its spider and passively scan each page it finds. Then ZAP will use the active scanner to attack all of the discovered pages, functionality, and parameters.

ZAP provides 2 spiders for crawling web applications, you can use either or both of them from this screen.

The traditional ZAP spider which discovers links by examining the HTML in responses from the web application. This spider is fast, but it is not always effective when exploring an AJAX web application that generates links using JavaScript.

For AJAX applications, ZAP’s AJAX spider is likely to be more effective. This spider explores the web application by invoking browsers which then follow the links that have been generated. The AJAX spider is slower than the traditional spider and requires additional configuration for use in a “headless” environment.

ZAP will passively scan all of the requests and responses proxied through it. So far ZAP has only carried out passive scans of your web application. Passive scanning does not change responses in any way and is considered safe. Scanning is also performed in a background thread to not slow down exploration. Passive scanning is good at finding some vulnerabilities and as a way to get a feel for the basic security state of a web application and locate where more investigation may be warranted.

Active scanning, however, attempts to find other vulnerabilities by using known attacks against the selected targets. Active scanning is a real attack on those targets and can put the targets at risk, so do not use active scanning against targets you do not have permission to test.

Interpret Your Test Results

As ZAP spiders your web application, it constructs a map of your web applications’ pages and the resources used to render those pages. Then it records the requests and responses sent to each page and creates alerts if there is something potentially wrong with a request or response.

See Explored Pages

To examine a tree view of the explored pages, click the Sites tab in the Tree Window. You can expand the nodes to see the individual URLs accessed.

View Alerts and Alert Details

The left-hand side of the Footer contains a count of the Alerts found during your test, broken out into risk categories. These risk categories are:

To view the alerts created during your test:

  1. Click the Alerts tab in the Information Window.
  2. Click each alert displayed in that window to display the URL and the vulnerability detected in the right side of the Information Window.
  3. In the Workspace Windows, click the Response tab to see the contents of the header and body of the response. The part of the response that generated the alert will be highlighted.

Exploring an Application Manually 

The passive scanning and automated attack functionality is a great way to begin a vulnerability assessment of your web application but it has some limitations. Among these are:

  • Any pages protected by a login page are not discoverable during a passive scan because, unless you’ve configured ZAP’s authentication functionality, ZAP will not handle the required authentication.
  • You don’t have a lot of control over the sequence of exploration in a passive scan or the types of attacks carried out in an automated attack. ZAP does provide many additional options for exploration and attacks outside of passive scanning.

Spiders are a great way to explore your basic site, but they should be combined with manual exploration to be more effective. Spiders, for example, will only enter basic default data into forms in your web application but a user can enter more relevant information which can, in turn, expose more of the web application to ZAP. This is especially true with things like registration forms where a valid email address is required. The spider may enter a random string, which will cause an error. A user will be able to react to that error and supply a correctly formatted string, which may cause more of the application to be exposed when the form is submitted and accepted.

You should explore all of your web application with a browser proxying through ZAP. As you do this, ZAP passively scans all the requests and responses made during your exploration for vulnerabilities, continues to build the site tree, and records alerts for potential vulnerabilities found during the exploration.

It is important to have ZAP explore each page of your web application, whether linked to another page or not, for vulnerabilities. Obscurity is not security, and hidden pages sometimes go live without warning or notice. So be as thorough as you can when exploring your site.

You can quickly and easily launch browsers that are pre-configured to proxy through ZAP via the Quick Start tab. Browsers launched in this way will also ignore any certificate validation warnings that would otherwise be reported.

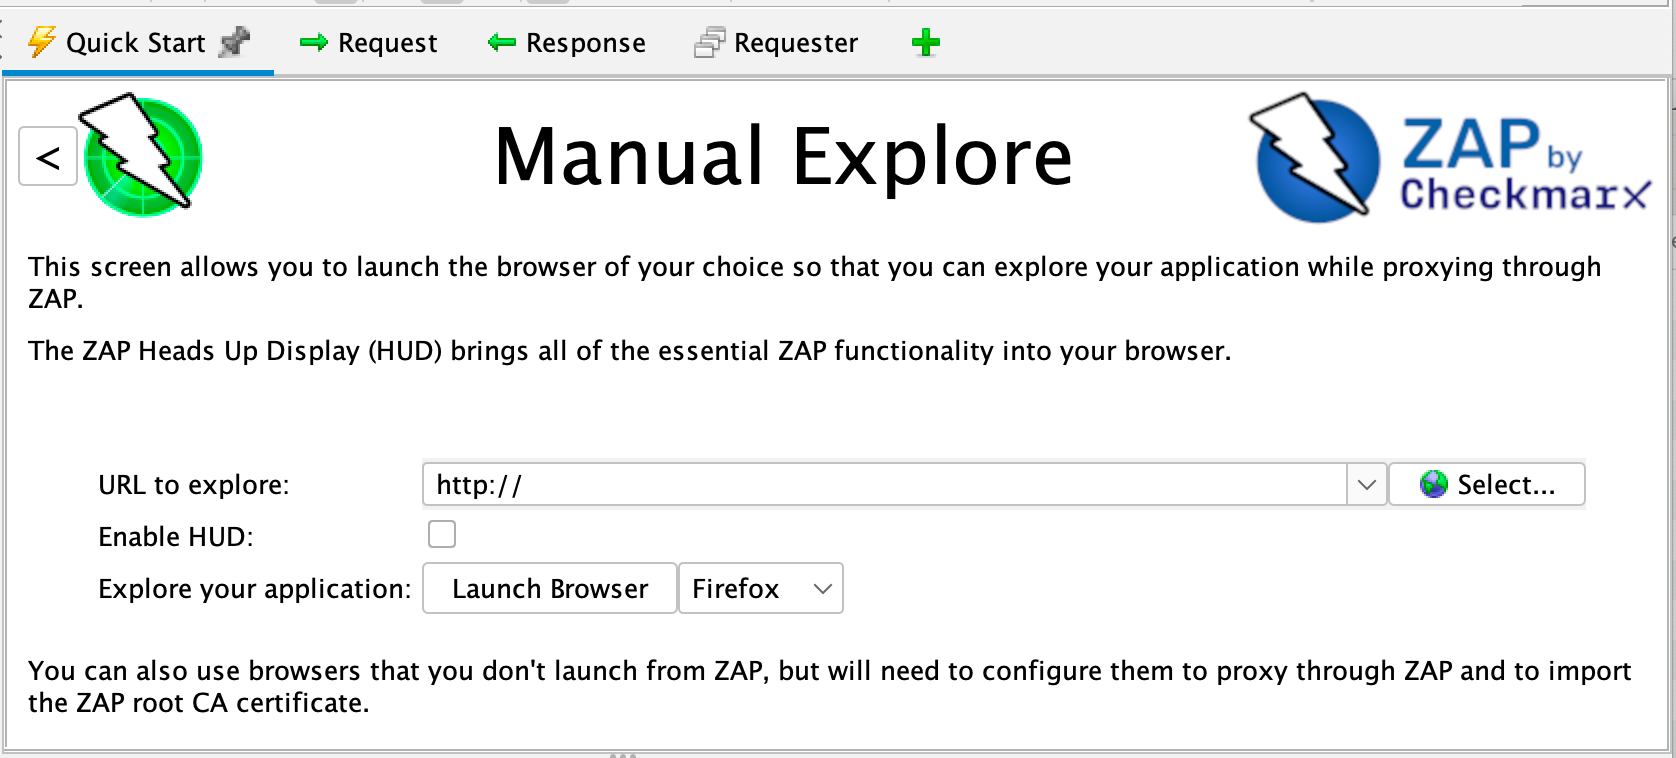
To Manually Explore your application:

  1. Start ZAP and click the Quick Start tab of the Workspace Window.
  2. Click the large Manual Explore button.
  3. In the URL to explore text box, enter the full URL of the web application you want to explore.
  4. Select the browser you would like to use
  5. Click the Launch Browser

This option will launch any of the most common browsers that you have installed with new profiles.

If you would like to use any of your browsers with an existing profile, for example with other browser add-ons installed, then you will need to manually configure your browser to proxy via ZAP and import and trust the ZAP Root CA Certificate. See the ZAP Desktop User Guide for more details.

By default the ZAP Heads Up Display (HUD) will be enabled. Unchecking the relevant option on this screen before launching a browser will disable the HUD.

The Heads Up Display 

The Heads Up Display (HUD) is a new an innovative interface that provides access to ZAP functionality directly in the browser. It is ideal for people new to web security and also allows experienced penetration testers to focus on an applications functionality while providing key security information and functionality.

The HUD is overlayed on top of the target application in your browser when enabled via the ‘Manual Explore’ screen or toolbar option. Only modern browsers such as Firefox and Chrome are supported.

By default a splash screen is shown for the HUD which includes a link to a tutorial which will take you through the HUD features and explain how you can use them.

ZAP Advanced Features 

Advanced Desktop Features 

The desktop has a large number of features that are not immediately apparent so that new users are not overwhelmed.

There are many tabs that are not shown by default. They can be accessed via the right hand tabs with green ‘+’ icons. You can pin any tabs you would like to always appear by right clicking on them. Many of the tabs hidden by default will appear when relevant. For example the Websockets tab will appear if an application you are proxying through ZAP starts to use Websockets.

The desktop also makes heavy use of context sensitive right click options, so right click everywhere while you are getting used to the user interface.

The ZAP Marketplace 

The ZAP desktop has a plugin architecture which means that new functionality can be added dynamically.

An online marketplace provides a wide range of ZAP add-ons which add many additional features to ZAP.

The marketplace can be accessed from within ZAP via the ‘Manage Add-ons’ button on the toolbar:

All of the add-ons on the marketplace are completely free.

Automation 

ZAP is an ideal tool to use in automation and supports a range of options:

Learn More About ZAP 

Now that you are familiar with a few basic capabilities of ZAP, you can learn more about ZAP’s capabilities and how to use them from ZAP’s Desktop User Guide. The User Guide provides step-by-step instructions, references for the API and command-line programming, instructional videos, and tips and tricks for using ZAP.

Additional links are also available via the ‘Learn More’ button on the Quick Start top screen:

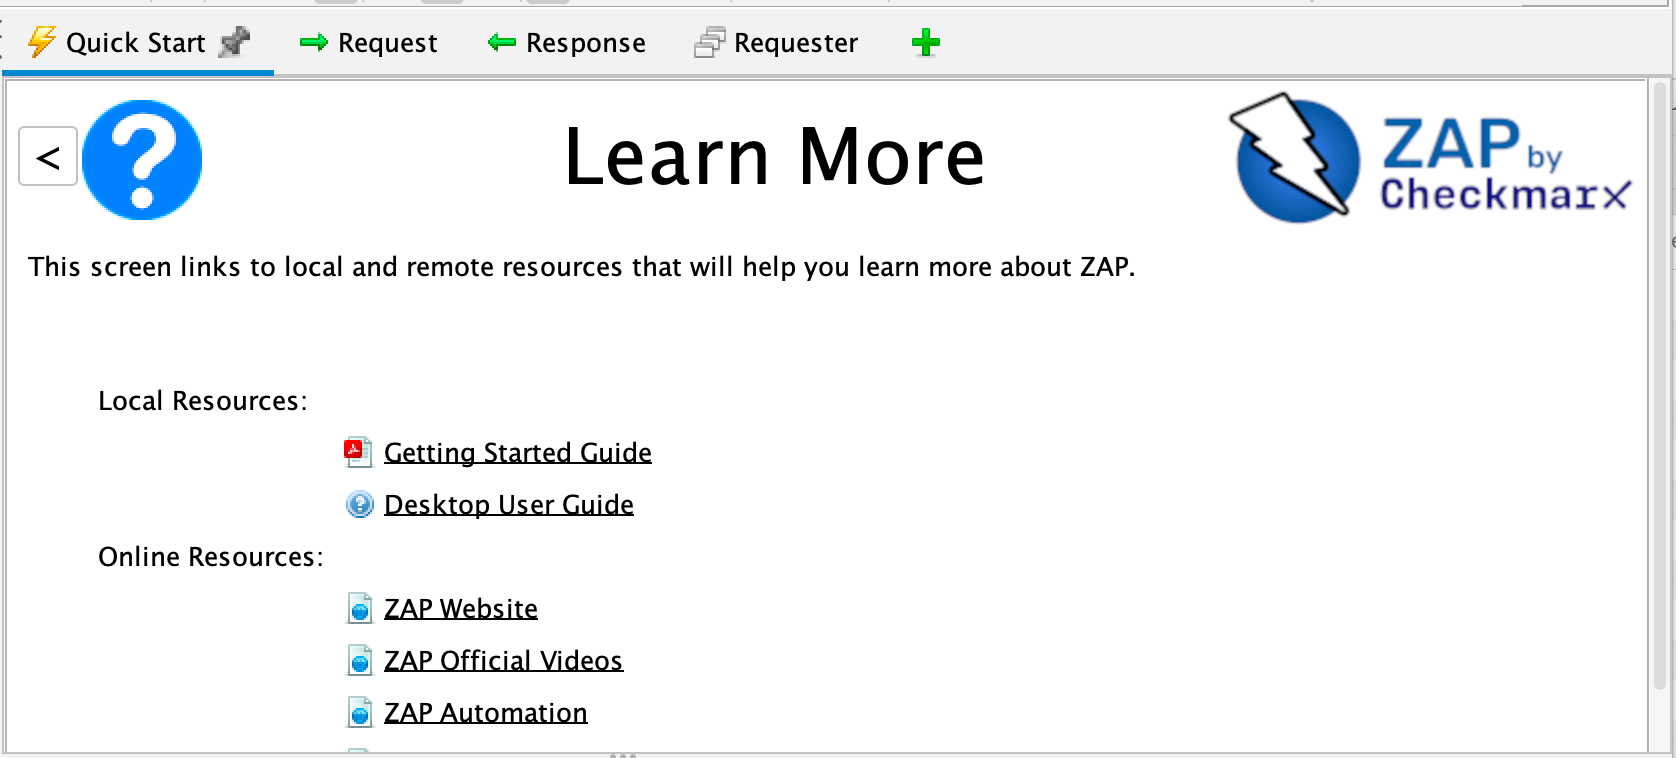
The screen links to both local resources (if available) and online content.

Security- Securing You Application

Who is the OWASP® Foundation?

The Open Web Application Security Project® (OWASP) is a nonprofit foundation that works to improve the security of software. Through community-led open-source software projects, hundreds of local chapters worldwide, tens of thousands of members, and leading educational and training conferences, the OWASP Foundation is the source for developers and technologists to secure the web.


The OWASP Top 10 is a standard awareness document for developers and web application security. It represents a broad consensus about the most critical security risks to web applications.

Globally recognized by developers as the first step towards more secure coding.

Companies should adopt this document and start the process of ensuring that their web applications minimize these risks. Using the OWASP Top 10 is perhaps the most effective first step towards changing the software development culture within your organization into one that produces more secure code.

Top 10 Web Application Security Risks

There are three new categories, four categories with naming and scoping changes, and some consolidation in the Top 10 for 2021.

Mapping

  • A01:2021-Broken Access Control moves up from the fifth position; 94% of applications were tested for some form of broken access control. The 34 Common Weakness Enumerations (CWEs) mapped to Broken Access Control had more occurrences in applications than any other category.
  • A02:2021-Cryptographic Failures shifts up one position to #2, previously known as Sensitive Data Exposure, which was broad symptom rather than a root cause. The renewed focus here is on failures related to cryptography which often leads to sensitive data exposure or system compromise.
  • A03:2021-Injection slides down to the third position. 94% of the applications were tested for some form of injection, and the 33 CWEs mapped into this category have the second most occurrences in applications. Cross-site Scripting is now part of this category in this edition.
  • A04:2021-Insecure Design is a new category for 2021, with a focus on risks related to design flaws. If we genuinely want to “move left” as an industry, it calls for more use of threat modeling, secure design patterns and principles, and reference architectures.
  • A05:2021-Security Misconfiguration moves up from #6 in the previous edition; 90% of applications were tested for some form of misconfiguration. With more shifts into highly configurable software, it’s not surprising to see this category move up. The former category for XML External Entities (XXE) is now part of this category.
  • A06:2021-Vulnerable and Outdated Components was previously titled Using Components with Known Vulnerabilities and is #2 in the Top 10 community survey, but also had enough data to make the Top 10 via data analysis. This category moves up from #9 in 2017 and is a known issue that we struggle to test and assess risk. It is the only category not to have any Common Vulnerability and Exposures (CVEs) mapped to the included CWEs, so a default exploit and impact weights of 5.0 are factored into their scores.
  • A07:2021-Identification and Authentication Failures was previously Broken Authentication and is sliding down from the second position, and now includes CWEs that are more related to identification failures. This category is still an integral part of the Top 10, but the increased availability of standardized frameworks seems to be helping.
  • A08:2021-Software and Data Integrity Failures is a new category for 2021, focusing on making assumptions related to software updates, critical data, and CI/CD pipelines without verifying integrity. One of the highest weighted impacts from Common Vulnerability and Exposures/Common Vulnerability Scoring System (CVE/CVSS) data mapped to the 10 CWEs in this category. Insecure Deserialization from 2017 is now a part of this larger category.
  • A09:2021-Security Logging and Monitoring Failures was previously Insufficient Logging & Monitoring and is added from the industry survey (#3), moving up from #10 previously. This category is expanded to include more types of failures, is challenging to test for, and isn’t well represented in the CVE/CVSS data. However, failures in this category can directly impact visibility, incident alerting, and forensics.
  • A10:2021-Server-Side Request Forgery is added from the Top 10 community survey (#1). The data shows a relatively low incidence rate with above average testing coverage, along with above-average ratings for Exploit and Impact potential. This category represents the scenario where the security community members are telling us this is important, even though it’s not illustrated in the data at this time.


Security Vulnerability Scanner ZAP

Zed Attack Proxy (ZAP) is a free and open-source web application security scanning tool developed by OWASP, a not-for-profit organization working to enhance the security of software applications. This tool is ideal for beginners to start security testing of web applications as it is easy to use, and installation is also quite easy. Although, these tools used by penetration testing professionals also. I feel that the ZAP tool is ideal for developers and functional testers to automate their applications' security testing. You can also use other tools like Selenium with ZAP to automate testing.

 Docker

Best practices for scanning images

This page contains recommendations and best practices for scanning and building secure images.

Docker and Snyk have partnered together to bring security natively into the development workflow by providing a simple and streamlined approach for developers to build and deploy secure containers. Container security spans multiple teams - developers, security, and operations. Additionally, there are multiple layers of security that apply to containers:

  • The container image and the software running inside
  • The interaction between a container, the host operating system, and other containers on the same host
  • The host operating system
  • Container networking and storage

Including the vulnerability scanning options into the Docker platform extends the existing, familiar process of vulnerability detection, and allows for remediation of vulnerabilities earlier in the development process. The process of simple and continuous checks, for example, by checking images in the background using Snyk Advisor, can lead to fewer vulnerabilities checked into Docker Hub. This can result in a shorter CI cycle and a more reliable deployment into production.

Developer's security journey

Scanning images

Log4j 2 CVE-2021-44228

Versions of docker scan earlier than v0.11.0 are not able to detect Log4j 2 CVE-2021-44228. You must update your Docker Desktop installation to version 4.3.1 or higher to fix this issue. For more information, see Scan images for Log4j 2 CVE.

You can trigger scans automatically by pushing an image to Docker Hub. You can achieve this either through the docker scan command in the CLI, or through Docker Hub.

Scan using the CLI

After you’ve built an image and before you push your image to Docker Hub, run the docker scan command. For detailed instructions on how to scan images using the CLI, see docker scan.

Docker Scan CL

Scan using Docker Hub

You can trigger scans, view, and inspect vulnerabilities through Docker Hub. For detailed information, see Hub Vulnerability Scanning.

Note

Docker Hub Vulnerability Scanning is available for developers subscribed to a Docker Pro, Team, or a Business tier. For more information about the pricing plans, see Docker Pricing.

Hub Vulnerability scanning

View the scan summary in Docker Desktop

Docker Desktop provides you a snapshot of your vulnerabilities status on the Docker Dashboard. Hover over the image and click View in Hub to view a detailed vulnerability report in Docker Hub.

Hub Vulnerability scan summary


git-secrets

Prevents you from committing passwords and other sensitive information to a git repository.

https://betterprogramming.pub/how-you-can-prevent-committing-secrets-and-credentials-into-git-repositories-adffc25c2ea2


Git hooks are scripts that run automatically every time a particular event occurs in a Git repository. They let you customize Git’s internal behavior and trigger customizable actions at key points in the development life cycle.

Hooks executing during the commit creation process

Common use cases for Git hooks include encouraging a commit policy, altering the project environment depending on the state of the repository, and implementing continuous integration workflows. But, since scripts are infinitely customizable, you can use Git hooks to automate or optimize virtually any aspect of your development workflow.


Thursday, 9 June 2022

How to install Git Secret on Windows

 Prerequisite:

Git must be configured in windows OS.

Clone awslabs/git-secrets repo using git-bash

Follow the below document to configure git-secrets globally…

  1. Update your git using git-bash. Execute the following command on git-bash.
git update-git-for-windows

2. Clone the repo

Command:

git clone https://github.com/awslabs/git-secrets.git

2. open PowerShell “run as administrator”

go to the repository where we clone the above repo. In my case path is

C:\users\dell\desktop\ttn\git-secrets

3. Check the version of the git.

git --version

4. Now execute the installation script of the windows. It simplifies the setup on windows.

./install.ps1

This might show an error like :

./install.ps1 : File C:\Users\Dell\desktop\ttn\git-secrets\install.ps1 cannot be loaded because running scripts is disabled on this system.

This is because the current PowerShell policy is restricted we can unrestricted it using the following command.

Set-ExecutionPolicy RemoteSigned

Below is the list of four different execution policies in PowerShell

  • Restricted — No scripts can be run.
  • AllSigned — Only scripts signed by a trusted publisher can be run.
  • RemoteSigned — Downloaded scripts must be signed by a trusted publisher.
  • Unrestricted — All Windows PowerShell scripts can be run.

5. Download the git-secrets.

git secrets --install

6. To add hooks to all the local repositories.

git secrets --install ~/.git-templates/git-secrets
git config --global init.templateDir ~/.git-templates/git-secrets

7. To add hooks to all repositories if we initialize or clone in the future.

git secrets --register-aws --global

Wednesday, 25 May 2022

Datadog - How to enable Process monitoring in datadog

 Step 1. Log into to your Server and edit the datadog config file

sudo vi /etc/datadog-agent/datadog.yaml


Step 2 Add the below lines at the bottom of the file
process_config:
    enabled: true 

 Step 3 Restart the datadog agent 


Step 4 . Go to Datadog ----infrastructure-----Processes and you will see all your processes


Tuesday, 17 May 2022

Kubernetes Cheat Sheet


Kubectl Cheatsheet

Kubectl is a command line interface for running commands against Kubernetes clusters.

Installing

The kubectl version has to be within one minor version difference of the Kubernetes cluster. For example, a v1.2 client should work with v1.1, v1.2, and v1.3 master.

Kubectl can be installed on Ubuntu, Debian, CentOS, RedHat operating systems.

Ubuntu / Debian

sudo apt-get update && sudo apt-get install -y apt-transport-https
curl -s https://packages.cloud.google.com/apt/doc/apt-key.gpg | sudo apt-key add -
echo "deb https://apt.kubernetes.io/ kubernetes-xenial main" | sudo tee -a /etc/apt/sources.list.d/kubernetes.list
sudo apt-get update
sudo apt-get install -y kubectl

CentOS / RedHat

cat <<EOF > /etc/yum.repos.d/kubernetes.repo
name=Kubernetes baseurl=https://packages.cloud.google.com/yum/repos/kubernetes-el7-x86_64 enabled=1 
gpgcheck=1 
repo_gpgcheck=1 
gpgkey=https://packages.cloud.google.com/yum/doc/yum-key.gpg https://packages.cloud.google.com/yum/doc/rpm-package-key.gpg 
EOF 

yum install -y kubectl

For further information about kubectl installation method, please refer to the Kubernetes documentation.

Completion

To easy manage the Kubernetes resources thanks to the command line Kubectl, the shell completion can be added to the shell profile to easily navigate in command line.

# Installing bash completion on macOS using homebrew
## If running Bash 3.2 included with macOS
brew install bash-completion
## or, if running Bash 4.1+
brew install bash-completion@2
## If kubectl is installed via homebrew, this should start working immediately.
## If you've installed via other means, you may need add the completion to your completion directory
kubectl completion bash > $(brew --prefix)/etc/bash_completion.d/kubectl


# Installing bash completion on Linux
## Load the kubectl completion code for bash into the current shell
source <(kubectl completion bash)
## Write bash completion code to a file and source if from .bash_profile
kubectl completion bash > ~/.kube/completion.bash.inc
printf "
# Kubectl shell completion
source '$HOME/.kube/completion.bash.inc'
" >> $HOME/.bash_profile
source $HOME/.bash_profile

# Load the kubectl completion code for zsh[1] into the current shell
source <(kubectl completion zsh)
# Set the kubectl completion code for zsh[1] to autoload on startup
kubectl completion zsh > "${fpath[1]}/_kubectl"

Syntax

Kubectl is a powerful tool to manage each object on a Kubernetes cluster. The command has a simple and unique syntax to manage everything :

kubectl [command] [TYPE] [NAME] [flags]
  • command : specifies the operation that you want to perform on one or more resources (create, get, describe, delete)
  • type : specifies the resource type. Resource types are case-insensitive and you can specify the singular, plural, or abbreviated forms
  • name : specifies the name of the resource. Names are case-sensitive. If the name is omitted, details for all resources are displayed
  • flags : specifies optional flags.

Useful basic commands

Create

Create a resource from a file or from stdin.

# Create a pod using the data in pod.json.
kubectl create -f ./pod.json

# Create a pod based on the JSON passed into stdin.
cat pod.json | kubectl create -f -

# Edit the data in docker-registry.yaml in JSON using the v1 API format then create the resource using the edited data.
kubectl create -f docker-registry.yaml --edit --output-version=v1 -o json

# Create all the resources avaibale in the folder 
kubeclt create -f <folder_name>

Delete

Delete resources by filenames, stdin, resources and names, or by resources and label selector.

# Delete a pod using the type and name specified in pod.json.
kubectl delete -f ./pod.json

# Delete a pod based on the type and name in the JSON passed into stdin.
cat pod.json | kubectl delete -f -

# Delete pods and services with same names "baz" and "foo"
kubectl delete pod,service baz foo

# Delete pods and services with label name=myLabel.
kubectl delete pods,services -l name=myLabel

# Delete a pod with minimal delay
kubectl delete pod foo --now

# Force delete a pod on a dead node
kubectl delete pod foo --grace-period=0 --force

# Delete all pods
kubectl delete pods --all

#Delete all resources available in the folder.
kubectl delete -f <folder_name>

Edit

Edit a resource from the default editor.

# Edit the service named 'docker-registry':
kubectl edit svc/docker-registry

# Use an alternative editor
KUBE_EDITOR="nano" kubectl edit svc/docker-registry

# Edit the job 'myjob' in JSON using the v1 API format:
kubectl edit job.v1.batch/myjob -o json

# Edit the deployment 'mydeployment' in YAML and save the modified config in its annotation:
kubectl edit deployment/mydeployment -o yaml --save-config

Expose

Expose a resource as a new Kubernetes service.

# Create a service for a replicated nginx, which serves on port 80 and connects to the containers on port 8000.
kubectl expose rc nginx --port=80 --target-port=8000

# Create a service for a replication controller identified by type and name specified in "nginx-controller.yaml", which serves on port 80 and connects to the containers on port 8000.
kubectl expose -f nginx-controller.yaml --port=80 --target-port=8000

# Create a service for a pod valid-pod, which serves on port 444 with the name "frontend"
kubectl expose pod valid-pod --port=444 --name=frontend

# Create a second service based on the above service, exposing the container port 8443 as port 443 with the name "nginx-https"
kubectl expose service nginx --port=443 --target-port=8443 --name=nginx-https

# Create a service for a replicated streaming application on port 4100 balancing UDP traffic and named 'video-stream'.
kubectl expose rc streamer --port=4100 --protocol=udp --name=video-stream

# Create a service for a replicated nginx using replica set, which serves on port 80 and connects to the containers on port 8000.
kubectl expose rs nginx --port=80 --target-port=8000

# Create a service for an nginx deployment, which serves on port 80 and connects to the containers on port 8000.
kubectl expose deployment nginx --port=80 --target-port=8000

# Access Pod without exposing as service using kubectl --raw
kubectl get pod <pod_name> -o yaml|grep selfLink
kubectl get --raw <selfLink>:port/proxy/<filename>

Get

Display one or many resources.

# List all pods.
kubectl get pods

# List all pods in ps output format with more information (such as node name).
kubectl get pods -o wide

# List a single replication controller with specified NAME in ps output format.
kubectl get replicationcontroller web

# List a single pod in JSON output format.
kubectl get -o json pod <pod-name>

# List a pod identified by type and name specified in "pod.yaml" in JSON output format.
kubectl get -f pod.yaml -o json

# Return only the phase value of the specified pod.
kubectl get -o template pod/<pod-name> --template=

# List all replication controllers and services together in ps output format.
kubectl get rc,services

# List one or more resources by their type and names.
kubectl get rc/web service/frontend pods/<pod-name>

# List all resources with different types.
kubectl get all

Run

Create and run a particular image, possibly replicated.

# Start a single instance of nginx.
kubectl run nginx --image=nginx

# Start a single instance of hazelcast and let the container expose port 5701 .
kubectl run hazelcast --image=hazelcast --port=5701

# Start a single instance of hazelcast and set environment variables "DNS_DOMAIN=cluster" and "POD_NAMESPACE=default" in the container.
kubectl run hazelcast --image=hazelcast --env="DNS_DOMAIN=cluster" --env="POD_NAMESPACE=default"

# Start a single instance of hazelcast and set labels "app=hazelcast" and "env=prod" in the container.
kubectl run hazelcast --image=nginx --labels="app=hazelcast,env=prod"

# Start a replicated instance of nginx.
kubectl run nginx --image=nginx --replicas=5

# Dry run. Print the corresponding API objects without creating them.
kubectl run nginx --image=nginx --dry-run

# Start a single instance of nginx, but overload the spec of the deployment with a partial set of values parsed from JSON.
kubectl run nginx --image=nginx --overrides='{ "apiVersion": "v1", "spec": { ... } }'

# Start a pod of busybox and keep it in the foreground, don't restart it if it exits.
kubectl run -i -t busybox --image=busybox --restart=Never

# Start the nginx container using the default command, but use custom arguments (arg1 .. argN) for that command.
kubectl run nginx --image=nginx -- <arg1> <arg2> ... <argN>

# Start the nginx container using a different command and custom arguments.
kubectl run nginx --image=nginx --command -- <cmd> <arg1> ... <argN>

# Start the perl container to compute π to 2000 places and print it out.
kubectl run pi --image=perl --restart=OnFailure -- perl -Mbignum=bpi -wle 'print bpi(2000)'

# Start the cron job to compute π to 2000 places and print it out every 5 minutes.
kubectl run pi --schedule="0/5 * * * ?" --image=perl --restart=OnFailure -- perl -Mbignum=bpi -wle 'print bpi(2000)'

Set

Configure application resources.

# Update deployment 'registry' with a new environment variable
kubectl set env deployment/registry STORAGE_DIR=/local

# List the environment variables defined on a deployments 'sample-build'
kubectl set env deployment/sample-build --list

# List the environment variables defined on all pods
kubectl set env pods --all --list

# Output modified deployment in YAML, and does not alter the object on the server
kubectl set env deployment/sample-build STORAGE_DIR=/data -o yaml

# Update all containers in all replication controllers in the project to have ENV=prod
kubectl set env rc --all ENV=prod

# Import environment from a secret
kubectl set env --from=secret/mysecret deployment/myapp

# Import environment from a config map with a prefix
kubectl set env --from=configmap/myconfigmap --prefix=MYSQL_ deployment/myapp

# Remove the environment variable ENV from container 'c1' in all deployment configs
kubectl set env deployments --all --containers="c1" ENV-

# Remove the environment variable ENV from a deployment definition on disk and
# update the deployment config on the server
kubectl set env -f deploy.json ENV-

# Set some of the local shell environment into a deployment config on the server
env | grep RAILS_ | kubectl set env -e - deployment/registry

# Set a deployment's nginx container image to 'nginx:1.9.1', and its busybox container image to 'busybox'.
kubectl set image deployment/nginx busybox=busybox nginx=nginx:1.9.1

# Update all deployments' and rc's nginx container's image to 'nginx:1.9.1'
kubectl set image deployments,rc nginx=nginx:1.9.1 --all

# Update image of all containers of daemonset abc to 'nginx:1.9.1'
kubectl set image daemonset abc *=nginx:1.9.1

# Print result (in yaml format) of updating nginx container image from local file, without hitting the server
kubectl set image -f path/to/file.yaml nginx=nginx:1.9.1 --local -o yaml

# Set a deployments nginx container cpu limits to "200m" and memory to "512Mi"
kubectl set resources deployment nginx -c=nginx --limits=cpu=200m,memory=512Mi

# Set the resource request and limits for all containers in nginx
kubectl set resources deployment nginx --limits=cpu=200m,memory=512Mi --requests=cpu=100m,memory=256Mi

# Remove the resource requests for resources on containers in nginx
kubectl set resources deployment nginx --limits=cpu=0,memory=0 --requests=cpu=0,memory=0

# Print the result (in yaml format) of updating nginx container limits from a local, without hitting the server
kubectl set resources -f path/to/file.yaml --limits=cpu=200m,memory=512Mi --local -o yaml

# Set Deployment nginx-deployment's ServiceAccount to serviceaccount1
kubectl set serviceaccount deployment nginx-deployment serviceaccount1

# Print the result (in yaml format) of updated nginx deployment with serviceaccount from local file, without hitting apiserver
kubectl set sa -f nginx-deployment.yaml serviceaccount1 --local --dry-run -o yaml

Useful deploy commands

Autoscale

Creates an autoscaler that automatically chooses and sets the number of pods that run in a kubernetes cluste

# Auto scale a deployment "foo", with the number of pods between 2 and 10, no target CPU utilization specified so a default autoscaling policy will be used:
kubectl autoscale deployment foo --min=2 --max=10

# Auto scale a replication controller "foo", with the number of pods between 1 and 5, target CPU utilization at 80%:
kubectl autoscale rc foo --max=5 --cpu-percent=80

Rollout

Manage the rollout of a resource.

# Rollback to the previous deployment
kubectl rollout undo deployment/abc

# Check the rollout status of a daemonset
kubectl rollout status daemonset/foo

# View the rollout history of a deployment
kubectl rollout history deployment/abc

# View the details of daemonset revision 3
kubectl rollout history daemonset/abc --revision=3

# Mark the nginx deployment as paused. Any current state of
# the deployment will continue its function, new updates to the deployment will not
# have an effect as long as the deployment is paused.
kubectl rollout pause deployment/nginx

# Resume an already paused deployment
kubectl rollout resume deployment/nginx

# Watch the rollout status of a deployment
kubectl rollout status deployment/nginx

# Rollback to the previous deployment
kubectl rollout undo deployment/abc

# Rollback to daemonset revision 3
kubectl rollout undo daemonset/abc --to-revision=3

# Rollback to the previous deployment with dry-run
kubectl rollout undo --dry-run=true deployment/abc

Scale

Set a new size for a Deployment, ReplicaSet, Replication Controller, or StatefulSet.

# Scale a replicaset named 'foo' to 3.
kubectl scale --replicas=3 rs/foo

# Scale a resource identified by type and name specified in "foo.yaml" to 3.
kubectl scale --replicas=3 -f foo.yaml

# If the deployment named mysql's current size is 2, scale mysql to 3.
kubectl scale --current-replicas=2 --replicas=3 deployment/mysql

# Scale multiple replication controllers.
kubectl scale --replicas=5 rc/foo rc/bar rc/baz

# Scale statefulset named 'web' to 3.
kubectl scale --replicas=3 statefulset/web

Useful cluster management commands

Cluster-info

Display addresses of the master and services with label kubernetes.io/cluster-service=true To further debug and diagnose cluster problems, use ‘kubectl cluster-info dump’.

# Print the address of the master and cluster services
kubectl cluster-info

Cordon / Uncordon

Mark node as (un)schedulable.

# Mark node "foo" as unschedulable.
kubectl cordon foo

# Mark node "foo" as schedulable.
$ kubectl uncordon foo

Drain

Drain node in preparation for maintenance.

# Drain node "foo", even if there are pods not managed by a ReplicationController, ReplicaSet, Job, DaemonSet or StatefulSet on it.
$ kubectl drain foo --force

# As above, but abort if there are pods not managed by a ReplicationController, ReplicaSet, Job, DaemonSet or StatefulSet, and use a grace period of 15 minutes.
$ kubectl drain foo --grace-period=90

#Drain node by ignoring Deamonsets
kubectl drain <node_name> --ignore-daemonsets

Taint

Update the taints on one or more nodes.

# Update node 'foo' with a taint with key 'dedicated' and value 'special-user' and effect 'NoSchedule'.
# If a taint with that key and effect already exists, its value is replaced as specified.
kubectl taint nodes foo dedicated=special-user:NoSchedule

# Remove from node 'foo' the taint with key 'dedicated' and effect 'NoSchedule' if one exists.
kubectl taint nodes foo dedicated:NoSchedule-

# Remove from node 'foo' all the taints with key 'dedicated'
kubectl taint nodes foo dedicated-

# Add a taint with key 'dedicated' on nodes having label mylabel=X
kubectl taint node -l myLabel=X  dedicated=foo:PreferNoSchedule

Top

Display Resource (CPU/Memory/Storage) usage.

# Show metrics for all nodes
kubectl top node

# Show metrics for a given node
kubectl top node NODE_NAME

# Show metrics for all pods in the default namespace
kubectl top pod

# Show metrics for all pods in the given namespace
kubectl top pod --namespace=NAMESPACE

# Show metrics for a given pod and its containers
kubectl top pod POD_NAME --containers

# Show metrics for the pods defined by label name=myLabel
kubectl top pod -l name=myLabel

Useful troubleshooting and debugging commands

Describe

Show details of a specific resource or group of resources.

# Describe a node
kubectl describe nodes kubernetes-node-emt8.c.myproject.internal

# Describe a pod
kubectl describe pods/<pod-name>

# Describe a pod identified by type and name in "pod.json"
kubectl describe -f pod.json

# Describe all pods
kubectl describe pods

# Describe pods by label name=myLabel
kubectl describe po -l name=myLabel

# Describe all pods managed by the 'frontend' replication controller (rc-created pods
# get the name of the rc as a prefix in the pod the name).
kubectl describe pods frontend

Exec

Execute a command in a container.

# Get output from running 'date' from pod 123456-7890, using the first container by default
kubectl exec 123456-7890 date

# Get output from running 'date' in ruby-container from pod 123456-7890
kubectl exec 123456-7890 -c ruby-container date

# Switch to raw terminal mode, sends stdin to 'bash' in ruby-container from pod 123456-7890
# and sends stdout/stderr from 'bash' back to the client
kubectl exec 123456-7890 -c ruby-container -i -t -- bash -il

# List contents of /usr from the first container of pod 123456-7890 and sort by modification time.
# If the command you want to execute in the pod has any flags in common (e.g. -i),
# you must use two dashes (--) to separate your command's flags/arguments.
# Also note, do not surround your command and its flags/arguments with quotes
# unless that is how you would execute it normally (i.e., do ls -t /usr, not "ls -t /usr").
kubectl exec 123456-7890 -i -t -- ls -t /usr

Logs

Print the logs for a container in a pod or specified resource. If the pod has only one container, the container name is optional.

# Return snapshot logs from pod nginx with only one container
kubectl logs nginx

# Return snapshot logs for the pods defined by label app=nginx
kubectl logs -lapp=nginx

# Return snapshot of previous terminated ruby container logs from pod web-1
kubectl logs -p -c ruby web-1

# Begin streaming the logs of the ruby container in pod web-1
kubectl logs -f -c ruby web-1

# Display only the most recent 20 lines of output in pod nginx
kubectl logs --tail=20 nginx

# Show all logs from pod nginx written in the last hour
kubectl logs --since=1h nginx

# Return snapshot logs from first container of a job named hello
kubectl logs job/hello

# Return snapshot logs from container nginx-1 of a deployment named nginx
kubectl logs deployment/nginx -c nginx-1

Proxy

Creates a proxy server or application-level gateway between localhost and the Kubernetes API Server. It also allows serving static content over specified HTTP path. All incoming data enters through one port and gets forwarded to the remote kubernetes API Server port, except for the path matching the static content path.

# To proxy all of the kubernetes api and nothing else, use:
$ kubectl proxy --api-prefix=/

# To proxy only part of the kubernetes api and also some static files:
$ kubectl proxy --www=/my/files --www-prefix=/static/ --api-prefix=/api/
# The above lets you 'curl localhost:8001/api/v1/pods'.

# To proxy the entire kubernetes api at a different root, use:
$ kubectl proxy --api-prefix=/custom/
# The above lets you 'curl localhost:8001/custom/api/v1/pods'

# Run a proxy to kubernetes apiserver on port 8011, serving static content from ./local/www/
kubectl proxy --port=8011 --www=./local/www/

# Run a proxy to kubernetes apiserver on an arbitrary local port.
# The chosen port for the server will be output to stdout.
kubectl proxy --port=0

Useful advanced commands

Apply

Apply a configuration to a resource by filename or stdin. The resource name must be specified. This resource will be created if it doesn’t exist yet. To use ‘apply’, always create the resource initially with either ‘apply’ or ‘create –save-config’.

# Apply the configuration in pod.json to a pod.
kubectl apply -f ./pod.json

# Apply the JSON passed into stdin to a pod.
cat pod.json | kubectl apply -f -

# Note: --prune is still in Alpha
# Apply the configuration in manifest.yaml that matches label app=nginx and delete all the other resources that are not in the file and match label app=nginx.
kubectl apply --prune -f manifest.yaml -l app=nginx

# Apply the configuration in manifest.yaml and delete all the other configmaps that are not in the file.
kubectl apply --prune -f manifest.yaml --all --prune-whitelist=core/v1/ConfigMap

Useful settings commands

label

Update the labels on a resource.

# Update pod 'foo' with the label 'unhealthy' and the value 'true'.
kubectl label pods foo unhealthy=true

# Update pod 'foo' with the label 'status' and the value 'unhealthy', overwriting any existing value.
kubectl label --overwrite pods foo status=unhealthy

# Update all pods in the namespace
kubectl label pods --all status=unhealthy

# Update a pod identified by the type and name in "pod.json"
kubectl label -f pod.json status=unhealthy

# Update pod 'foo' only if the resource is unchanged from version 1.
kubectl label pods foo status=unhealthy --resource-version=1

# Update pod 'foo' by removing a label named 'bar' if it exists.
# Does not require the --overwrite flag.
kubectl label pods foo bar-

Useful other commands

Config

Modify kubeconfig files using subcommands like “kubectl config set current-context my-context”.

# Display the current-context
kubectl config current-context

# Delete the minikube cluster
kubectl config delete-cluster minikube

# Delete the context for the minikube cluster
kubectl config delete-context minikube

# List the clusters kubectl knows about
kubectl config get-clusters

# List the context kubectl knows about
kubectl config get-contexts

# Rename the context 'old-name' to 'new-name' in your kubeconfig file
kubectl config rename-context old-name new-name

# Set only the server field on the e2e cluster entry without touching other values.
kubectl config set-cluster e2e --server=https://1.2.3.4

# Embed certificate authority data for the e2e cluster entry
kubectl config set-cluster e2e --certificate-authority=~/.kube/e2e/kubernetes.ca.crt

# Disable cert checking for the dev cluster entry
kubectl config set-cluster e2e --insecure-skip-tls-verify=true

# Set the user field on the gce context entry without touching other values
kubectl config set-context gce --user=cluster-admin

# Use the context for the minikube cluster
kubectl config use-context minikube

Version

Print the client and server version information for the current context.

# Print the client and server versions for the current context
kubectl version

How to upgrade Maven

  java.lang.IllegalStateException I had installed maven in my ubuntu using command  apt install maven This installed maven in path /usr/shar...