How to enable Apache Tomcat monitoring in Datadog Agent
Datadog is a monitoring service for cloud-scale applications that brings events and metrics from servers, databases, applications, tools and services to present a unified view of the infrastructure, which help them to work collaboratively on the infrastructure to avoid latency, resolve performance problems, and ensure that development and deployment cycles finish on time.
Apache Tomcat Integratoion with Datadog collects Following Tomcat metrics
- Overall activity metrics: error count, request count, processing times, etc.
- Thread pool metrics: thread count, number of threads busy, etc.
- Servlet processing times
Step 1 – Sign up for a Datadog Account
Go to : https://www.datadoghq.com/
Click on Free Trial

Fill the form to sign up
Next: Select your Stack. You can select Tomcat for now

Step 2: Install the datadog Agent on your Tomcat Server

Select your OS:Ubuntu
Then copy the command in the box:Use our easy one step install

Log into your Tomcat server and paste and run the command to install datadog agent
DD_AGENT_MAJOR_VERSION=7 DD_API_KEY=4cf1ee64a11f9c21c2020b85376e552c DD_SITE="datadoghq.com" bash -c "$(curl -L https://s3.amazonaws.com/dd-agent/scripts/install_script.sh)"


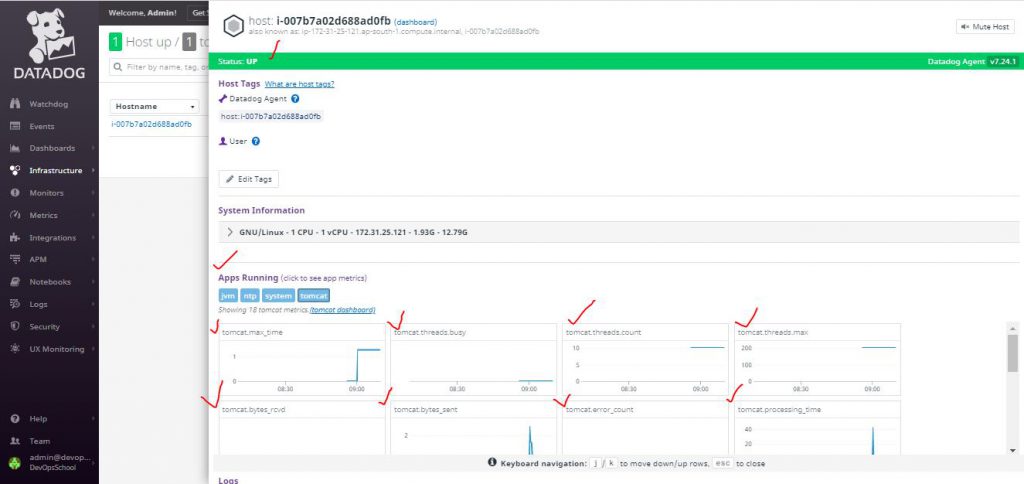
Select your host: And you should see the metric graphs


No comments:
Post a Comment